
Tools
Tools that build corporate geoeconomic capability.
Frameworks and live intelligence built specifically for geoeconomics, not traditional geopolitical risk models.
Three diagnostics and a live tracker
Each diagnostic answers a question your board is likely to ask, and all three build on the ESF Corporate Geoeconomic Framework, so what we find in one carries into the next. The Corporate Response Tracker adds live intelligence on how Europe's largest companies are repositioning.
Supply Chain Exposure Assessment
Finding the dependencies your Tier 1 view cannot see.
Every organisation has a supplier it cannot easily replace, in a country it cannot control, through a chokepoint it cannot route around. This deep-tier assessment finds the convergence, chokepoints and single points of failure your Tier 1 view cannot show you, before they become your crisis.
Tier 1 visibility creates a false sense of security. Approved suppliers across several geographies can look diversified on paper, yet converge upstream on the same source, the same processing node or the same port. "China+1" routes often keep their China-based inputs, and one disruption can strike several qualified routes at once.
We map your supply base several tiers below your own visibility, from open and structural data, with no supplier cooperation required. The mapping is computational, run with our analytics partner, and ESF's analysts turn it into an assessment brief you can act on.
One motor, 435 industries, 14 tiers
A standard three-phase induction motor is a familiar product. Mapped upstream, it resolves into 435 industries across 14 supply tiers, from the finished product to raw material. Behind those industries sit 8,398 identified companies and 4,825 factory locations. Open one input at tier 6, the electrical-steel sheet in the stator, and it becomes 60 producers, with 30% of their located sites in a single country. Open one producer, and it becomes three plants. That is what Phase 1 sees that a Tier 1 register cannot.
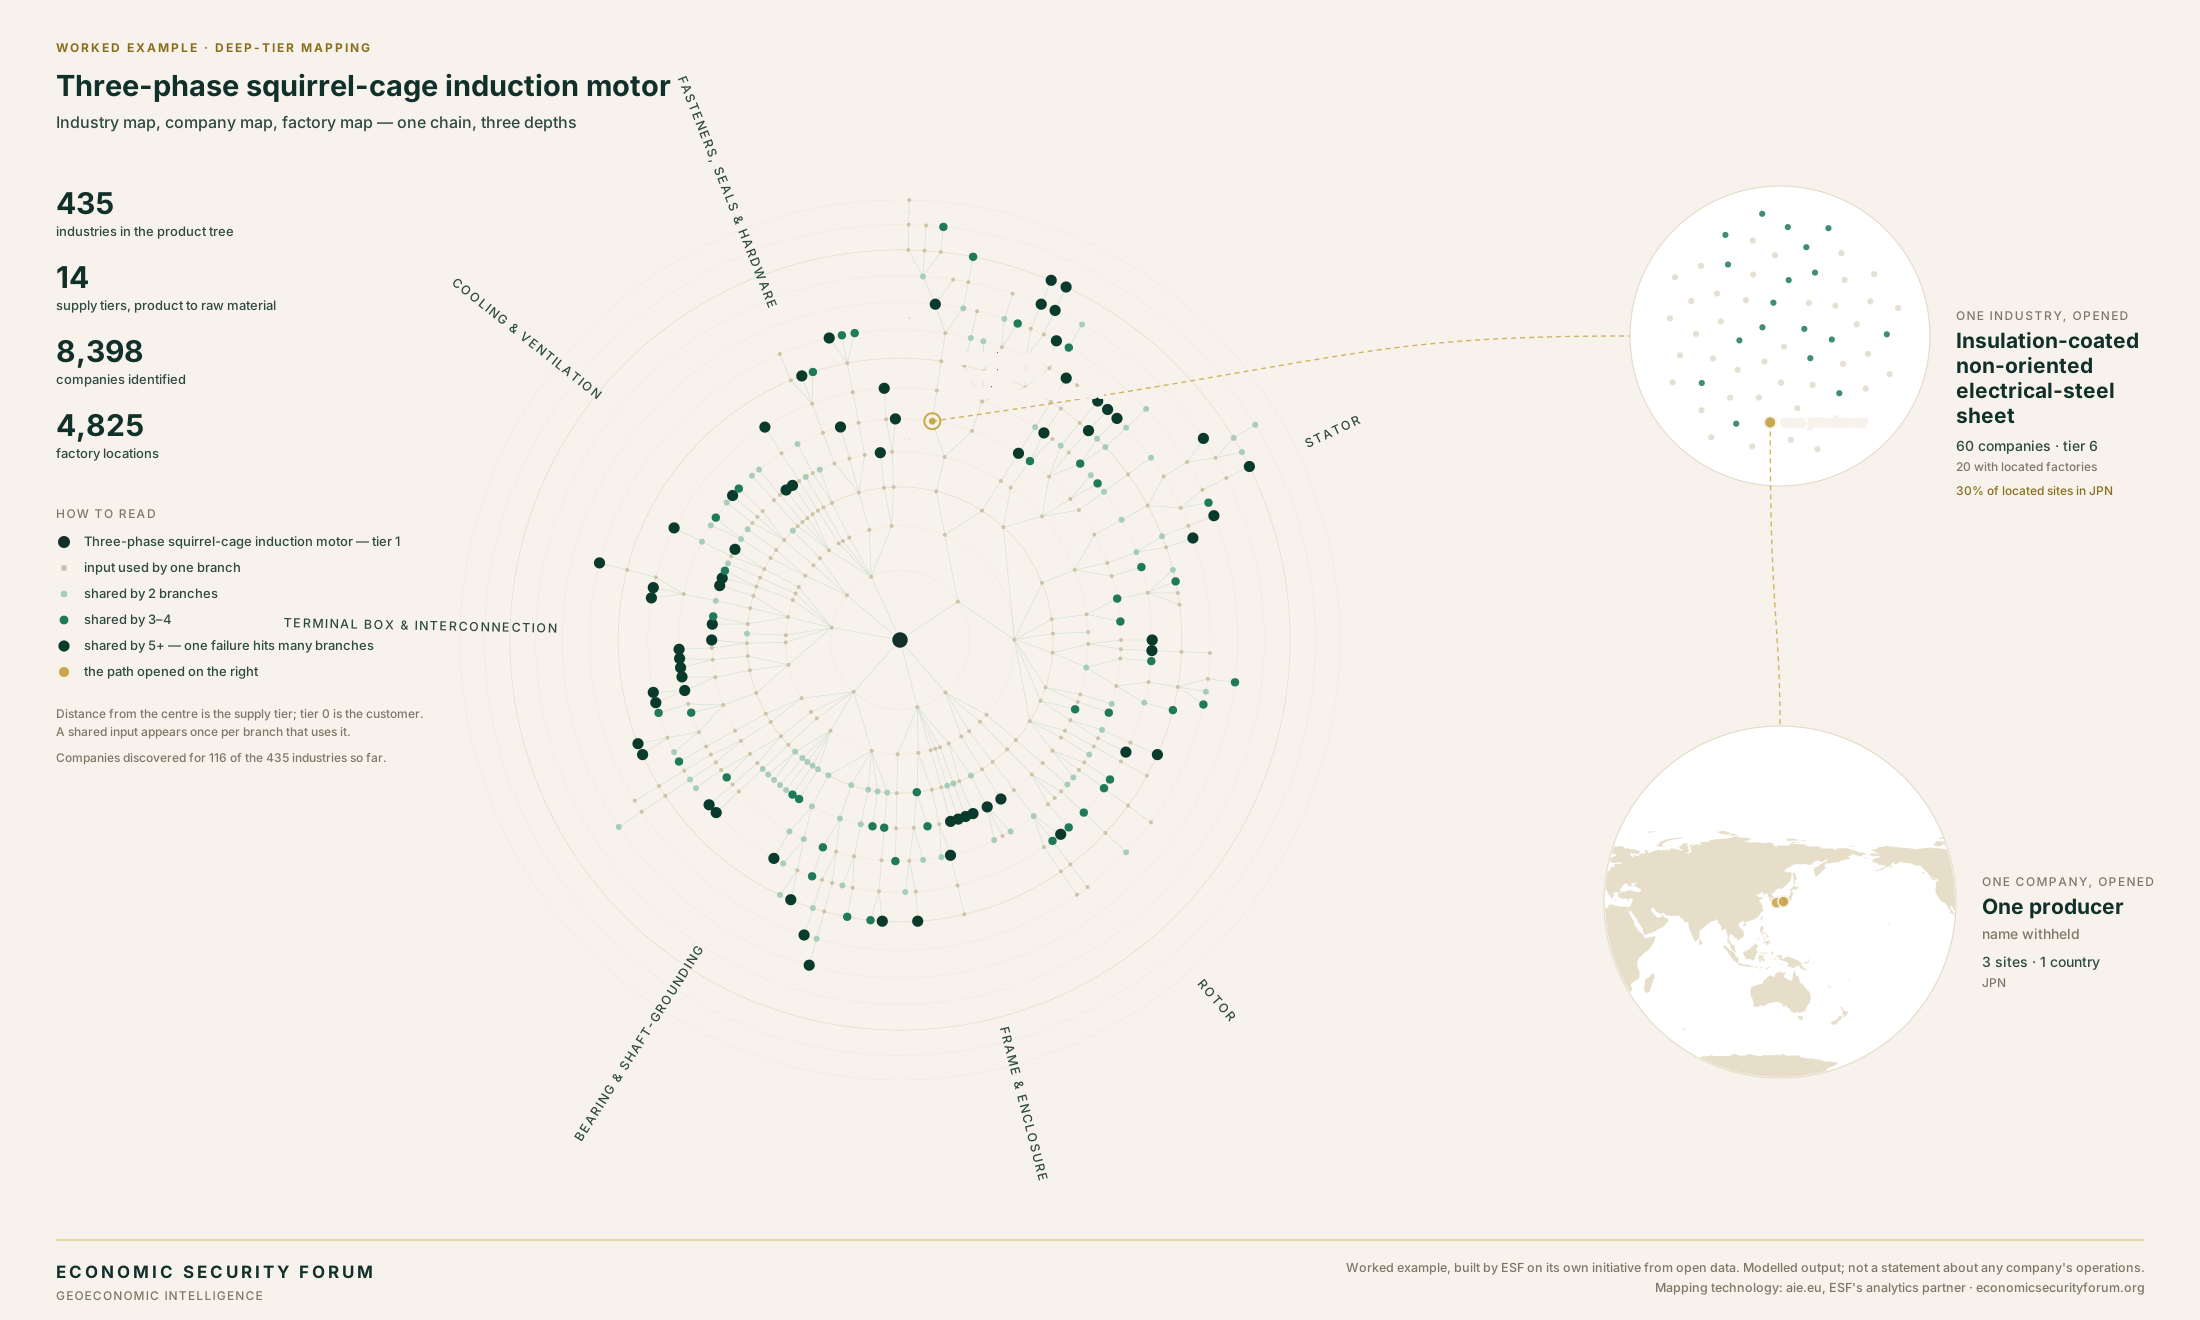
Worked example modelled from open data by ESF with its analytics partner aie.eu. Not a statement about any company's operations.
4,703 factories mapped across 2,380 suppliers for a European technology manufacturer. The gap between the two numbers is the exposure no traditional supplier register can show you.
How it runs: four gated phases
Each phase is agreed only after the previous one has delivered. You can stop at any point.
What the mapping surfaces
Six patterns that hide beneath a diversified supply base.
None of these are visible from a Tier 1 supplier register, and few can be found by asking Tier 1 suppliers alone.
What arrives in 2 to 3 weeks
What it does not do
Phase 1 is a directional screen, not a compliance-grade assessment. Confidence declines with depth, and we report it rather than smooth it.

Dr. Christian Fjäder
Tell us which component families concern you. Most engagements start with a Fast-Track Deep-Tier Scan: one scoping session, then a first read in 2 to 3 weeks.
Geoeconomic Moat Assessment
You know what protects you from competitors. What protects you from governments?
Every classic source of competitive moat, from network effects to cost advantage, can now be built or broken by a state. A subsidy hands a rival a cost base you cannot match; a revoked licence erases an intangible asset. Your moat has been assessed against competitors. It has rarely been assessed against states.
Built around the ESF Corporate Geoeconomic Framework, the assessment reads both your positioning and your internal capabilities for building geoeconomic leverage and resilience. It measures your Unique Leverage Proposition: what makes you hard for a state to replace, coerce or route around. It is typically commissioned around the decisions where the stakes are highest: a market entry, an acquisition or a major investment. The concept was first published by Dr. Heiko Borchert and Dr. Mikael Wigell in fDi Intelligence.
Five modes of geoeconomic leverage
The strategy layer turns the diagnostic into moves: four active ones, and absorption done better than competitors, which is itself an opportunity.
Commission the whole assessment, or start with one module
What we need from you: survey time from senior managers, five to seven interviews and half a day of leadership time.
Dr. Christian Fjäder
Tell us the decision you are facing. Most engagements start with the outside-in read, Forces and Flows, researched by ESF with almost no demand on your time, and the full programme runs in ten weeks.
Strategy stress test
Geoeconomic Fitness Test
Can your strategy survive more than one future?
A structured stress test of whether your strategy and key management functions remain viable across materially different geoeconomic futures, and what to do now to prepare.
It builds on the same ESF Corporate Geoeconomic Framework as our other diagnostics, so what we find in one carries into the next. Where the Geoeconomic Moat Assessment's Fitness module tests a position the diagnostic has just mapped, the Geoeconomic Fitness Test starts from your strategy and asks whether it survives. The two can run together or apart.
Built around a half-day workshop, aimed at a decision
A geoeconomic stress test of corporate strategy, producing non-regret measures that hold across futures rather than another risk register.
Risk is the entry point
It gives risk and governance functions a structured way to bring geoeconomic uncertainty to management. Strategy and the board are the destination.
A recurring process
The first assessment sets a baseline. A periodic Fitness Refresh updates the scenarios, reviews progress and keeps the board package current.
How it runs: five steps
01
Scenario architecture
Three to four divergent geoeconomic futures, built for your company.
02
Functional stress test
A structured assessment across your management functions: the Geoeconomic Fitness Matrix.
03
Enterprise exposure
Patterns across functions become an enterprise-level exposure map.
04
Strategy synthesis
A facilitated workshop on scenario options, strategic hedges and non-regret measures.
05
Board package
A standard deliverable for risk, audit and the full board.
The Corporate Response Tracker
See how Europe's largest companies are repositioning across the Atlantic. The tracker follows STOXX Europe 600 companies as they invest in the US, pull back from it or shift their supply chains, with a public source behind every entry.
- Who is movingInvestments, withdrawals and supply chain shifts, company by company.
- Where and how muchTarget region, sector and the scale of each move where it is disclosed.
- On the recordStructured AI analysis of public disclosures, with a source link for every entry.
Full access adds sector exports, historical trends and email alerts.